Excel Analysis of JSON Data
- Richard Frykberg
This tutorial demonstrates how you can analyse FAB data in Excel. FAB instances are stored internally within SAP tables in JSON data format. Depending on the form complexity, the data may be represented as a deep data structure comprising multiple subordinate line items.
Care should be taken when flattening JSON data into an Excel table to ensure that repeated rows containing a total are not duplicated when including the row totals of a child structure
Here is an example file:
CER_EXPORT JSON QUERY Example.xlsx
Instructions
/n/IQX/FAB_DATA_ANALYSIS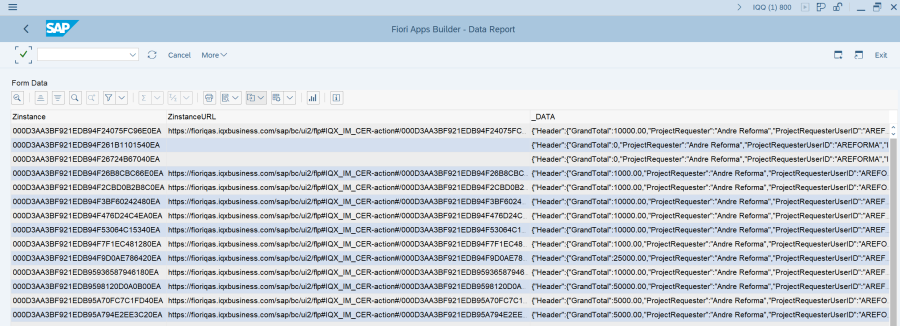
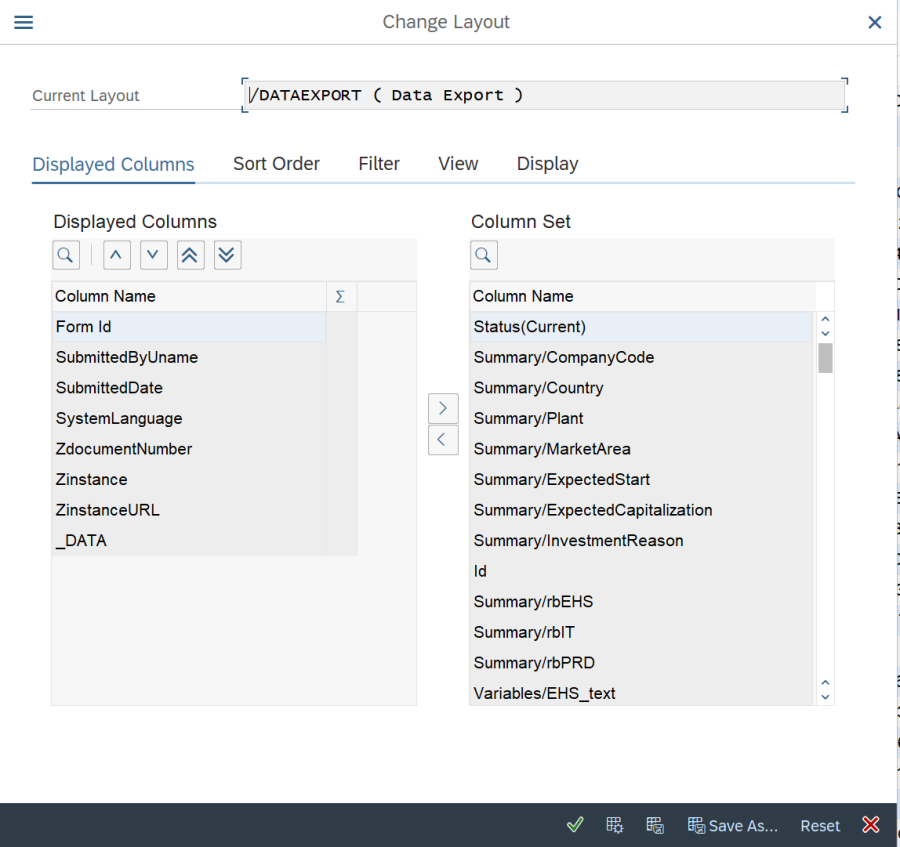
Change Layout to focus on Data: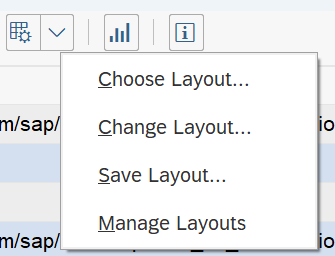
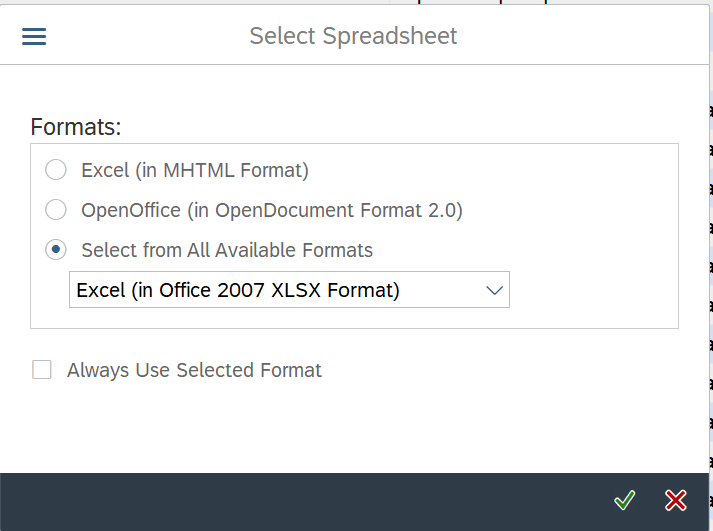
Export to Excel: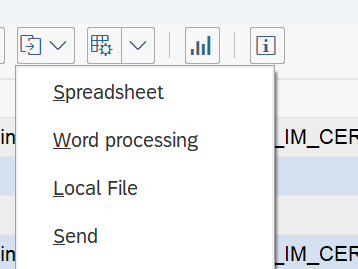
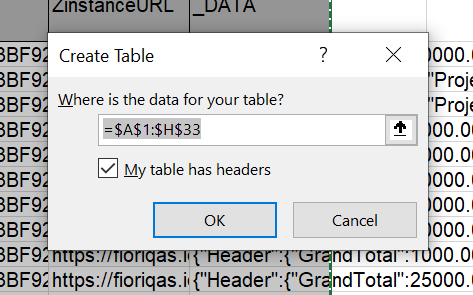
Open the downloaded file in Excel and highlight range: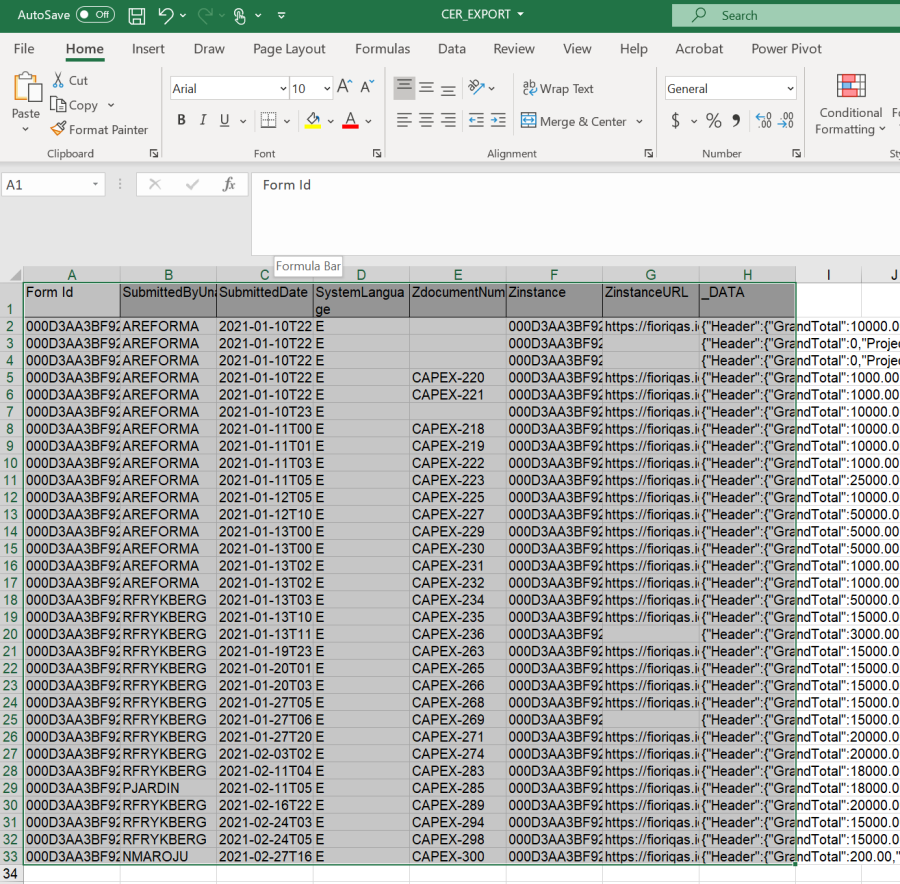
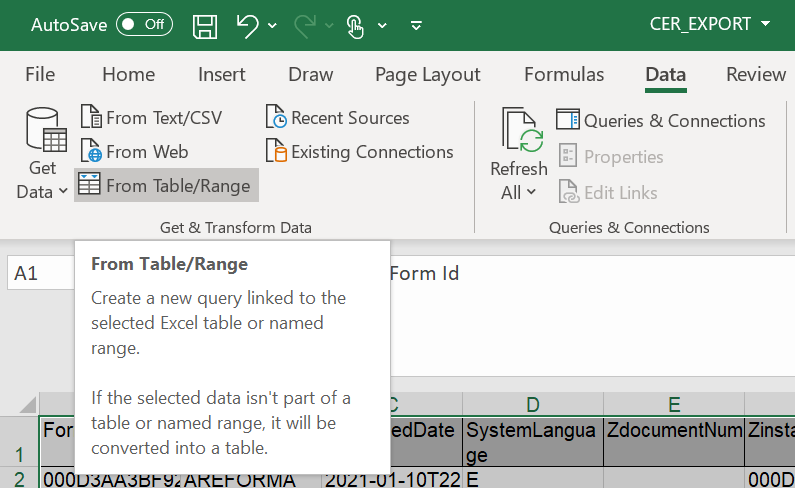
Select the _DATA column and then select Transform>PARSE>JSON from the menu: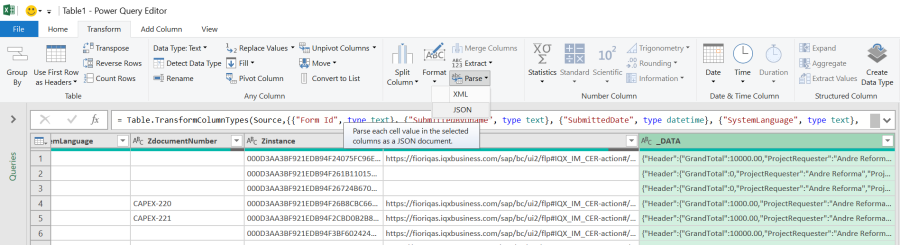
This will convert JSON to a Record: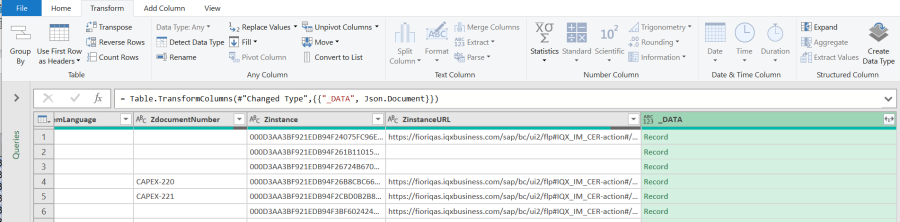
Expand the Data by clicking top-right icon and selecting the record fields to view: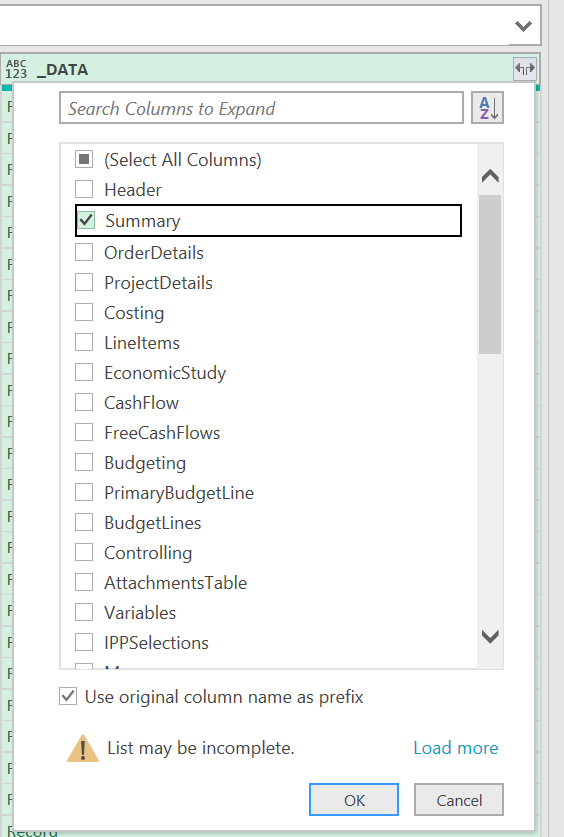
IN this example, the Summary filed is itself a record: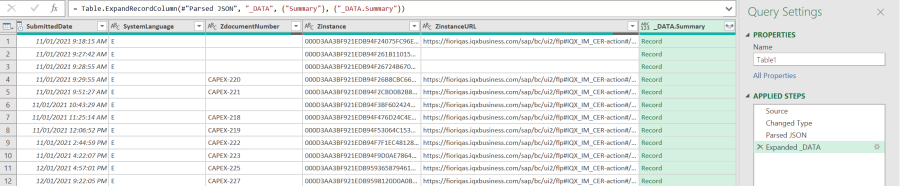
Click on "Record" to view sample content: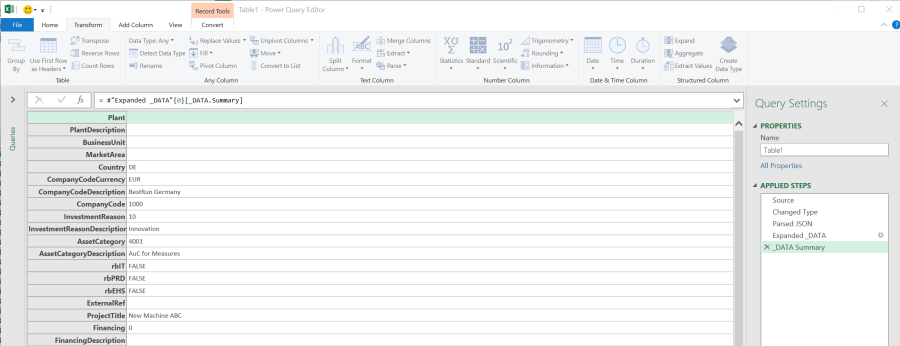
In the Query Settings Applied Steps window, Click x to delete the expand list, and then expand again to select your specific attribute: 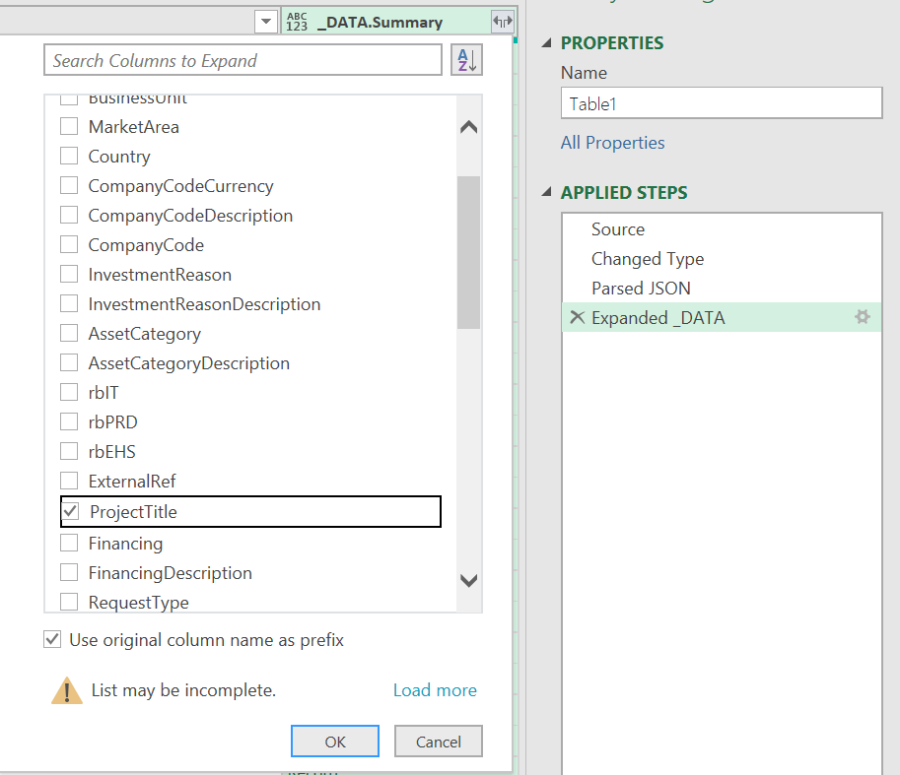
The column now has the required JSON content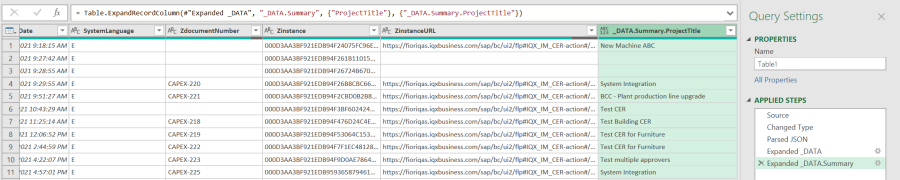
Note the Query Steps are shown in the right hand panel.
Click File > Close and Load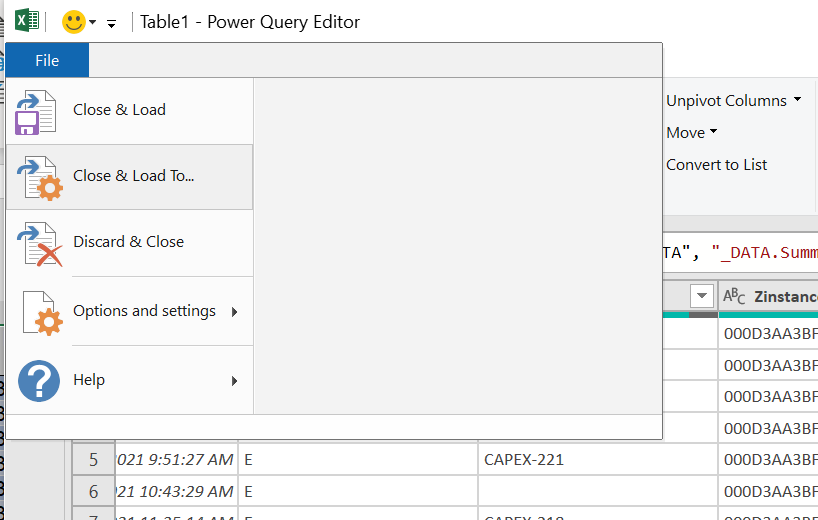
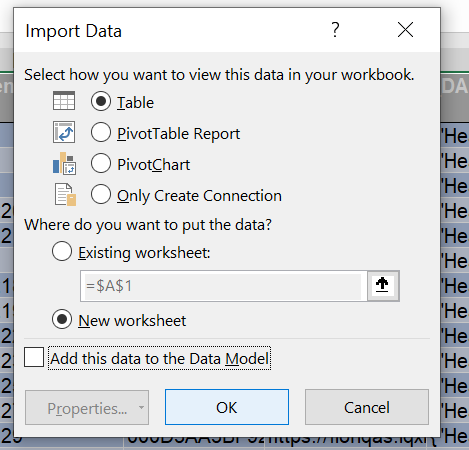
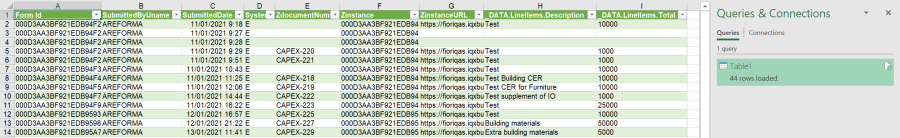
The data is now extracted from JSON and presented in a Column: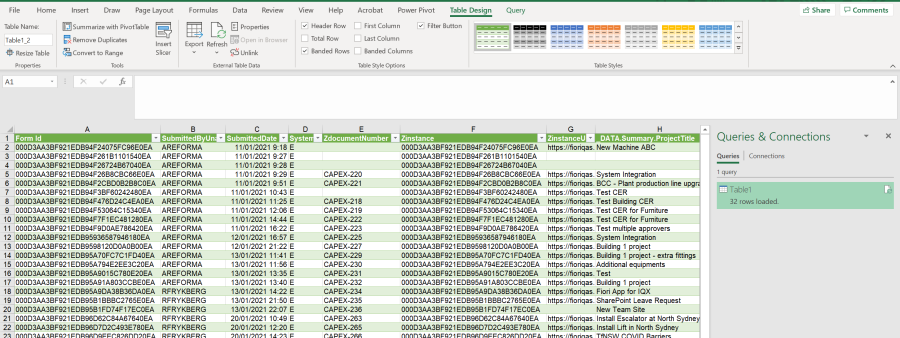
The Query Can be refreshed: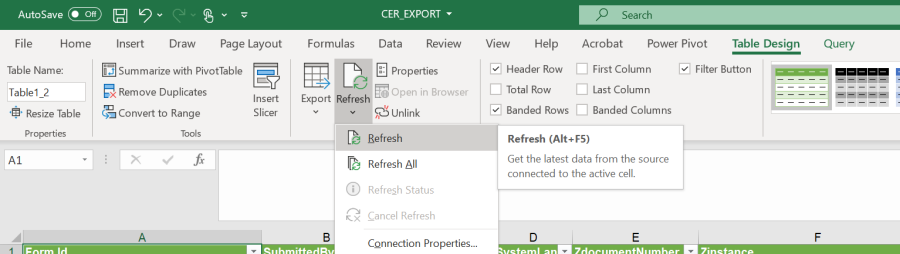
If you want to view line items within a Record, change the query by first deleting the last 2 steps and then click Expand ot include a JSON node containing Line Items eg: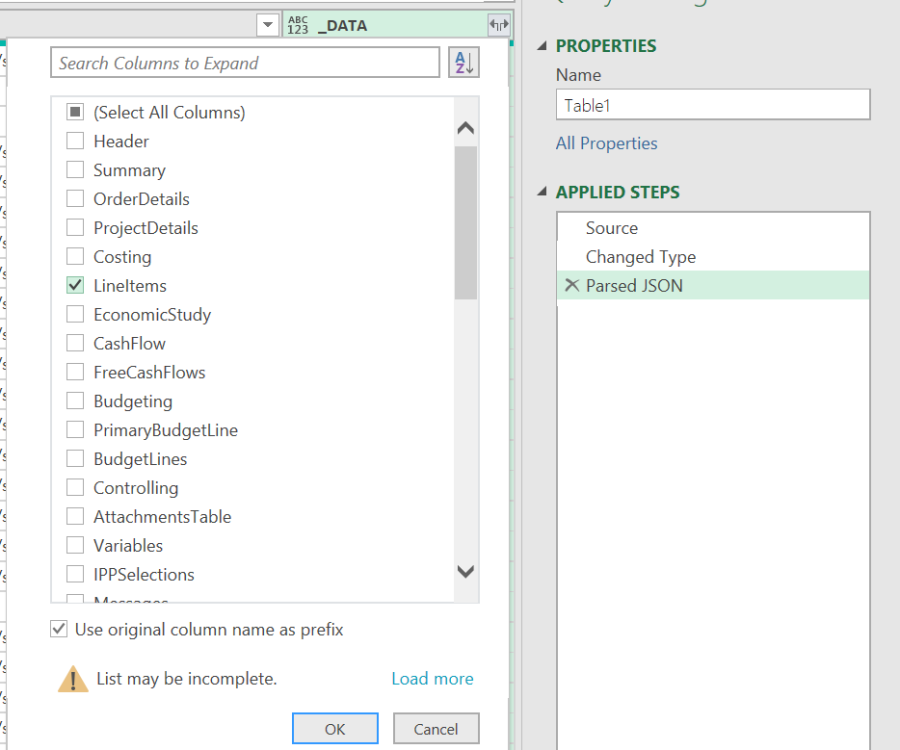
This now shows the content of the JSON as a List: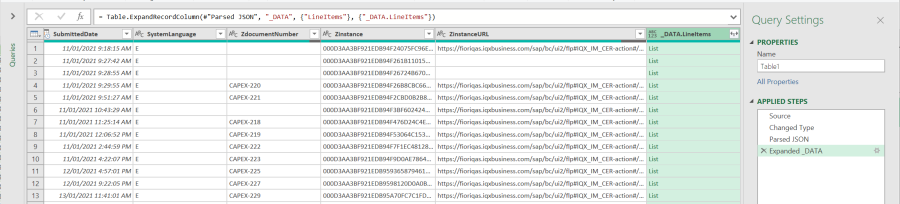
This time, clicking the Expansion icon on top right of column allows Expand to New Rows: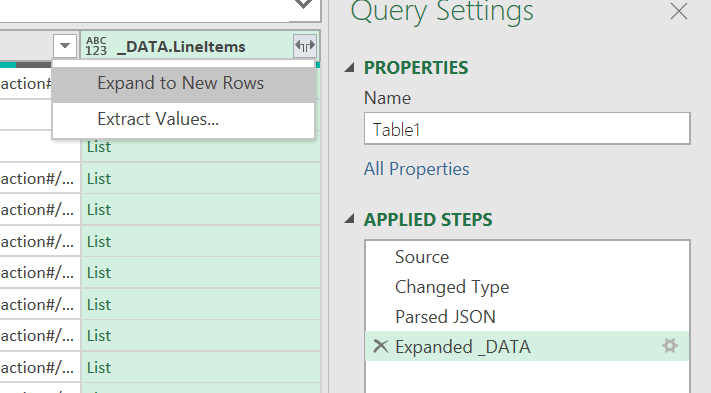
This effectively creates a duplicate row for each unique item: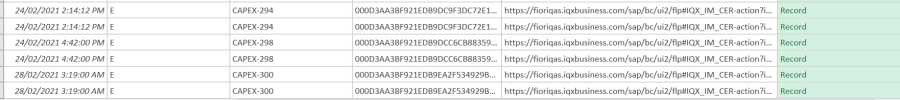
Now select the columns to Expand: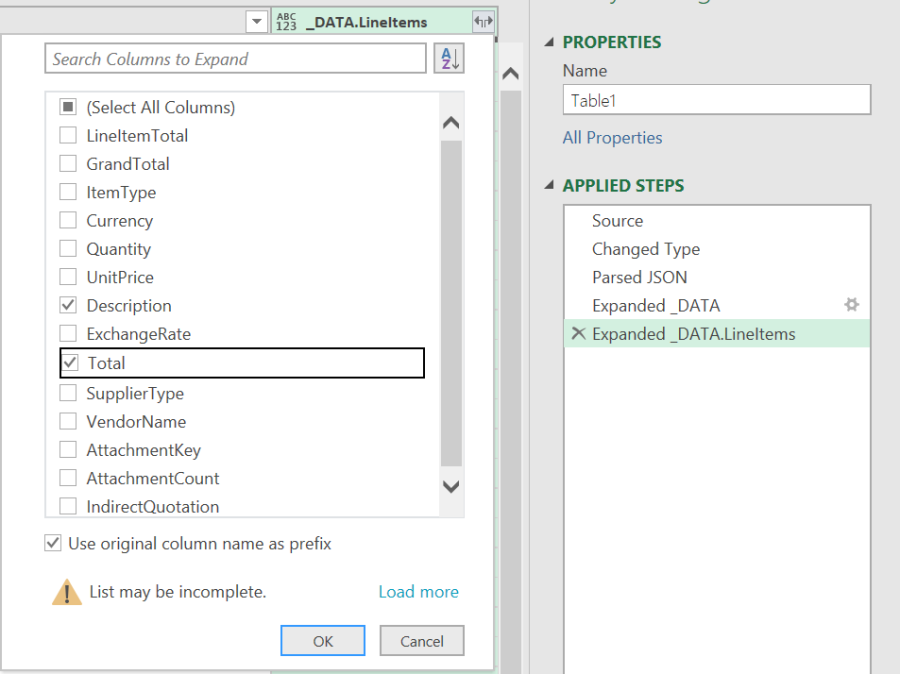
This now creates an additional column for each selected record attribute: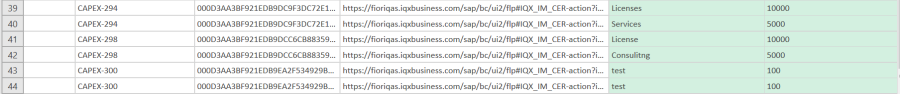
Close and Load and the report now contains extra rows and columns: